(c) 2022 by Barton Paul Levenson
The poster on RealClimate who signs himself Victor (possibly Victor Grauer of my home town of Pittsburgh) is that rarity, a liberal AGW denier. Victor insists there's no correlation between carbon dioxide and mean global annual surface temperature. Of course there is--see, for example, here. Victor doesn't know his statistics. But let's look at a possible explanation for his mistake.
He insists, for example, that while CO2 rose from 1940 to 1978, temperature fell. That's not quite true--while the slope of temperature versus year for that period is negative at -0.00236 K per year, the t-statistic on the slope is insignificant: t = -1.27, for p < 0.212. So the error bars are wider than the slope, and for all we know, given the noisiness of the data, it could have actually been rising. But give him his point for the moment. Does it prove what he thinks it does?
No. CO2 is not the only thing that affects temperature. Other factors known to have effects on Earth's temperature are sunlight, volcanic aerosols, aerosols from pollution, heat cycles between the atmosphere and the ocean (such as El Nińo), variations in cloudiness, other greenhouse gases, etc., etc., etc. So some other factor might have suppressed temperature during those years. By 1978 (actually, according to statistician Grant Foster, 1975) CO2 had come to dominate everything else and global warming really took off.
Let's examine a bunch of data for the period. Here is data on temperature and several other factors for the years 1850-2019. Not all are complete, unfortunately, but we've got complete coverage from 1866 onward and 2018 backward.
| Year | dT | CO2 | SN | TSI | SOI | Aerosols |
|---|---|---|---|---|---|---|
| 1850 | -0.239 | 284.7 | 126.3 | 1361.7005 | -0.077 | |
| 1851 | -0.004 | 284.9 | 122 | 1361.5037 | -0.027 | |
| 1852 | -0.137 | 285.0 | 102.7 | 1361.4177 | 0.004 | |
| 1853 | -0.326 | 285.1 | 74.1 | 1361.2921 | 0.110 | |
| 1854 | -0.125 | 285.3 | 39 | 1361.0975 | 0.237 | |
| 1855 | -0.522 | 285.4 | 12.7 | 1360.9770 | -0.210 | |
| 1856 | -0.587 | 285.6 | 8.2 | 1360.8772 | 0.036 | |
| 1857 | -0.580 | 285.7 | 43.4 | 1360.9499 | -0.335 | |
| 1858 | -0.555 | 285.9 | 104.4 | 1361.1913 | -0.090 | |
| 1859 | -0.193 | 286.1 | 178.3 | 1361.4779 | -0.051 | |
| 1860 | -0.649 | 286.2 | 182.2 | 1361.6335 | -0.217 | |
| 1861 | -0.516 | 286.4 | 146.6 | 1361.6242 | -0.022 | |
| 1862 | -0.756 | 286.5 | 112.1 | 1361.4956 | -0.230 | |
| 1863 | -0.275 | 286.6 | 83.5 | 1361.3489 | 0.302 | |
| 1864 | -0.825 | 286.8 | 89.2 | 1361.2972 | -0.092 | |
| 1865 | -0.453 | 286.9 | 57.8 | 1361.2800 | -0.083 | |
| 1866 | -0.440 | 287.0 | 30.7 | 1361.1589 | -0.16 | 0.039 |
| 1867 | -0.603 | 287.1 | 13.9 | 1361.0301 | -0.03 | -0.471 |
| 1868 | -0.424 | 287.2 | 62.8 | 1361.1520 | -0.88 | -0.317 |
| 1869 | -0.393 | 287.4 | 123.6 | 1361.4661 | 0.55 | 0.057 |
| 1870 | -0.549 | 287.5 | 232 | 1361.6794 | -0.15 | -0.236 |
| 1871 | -0.659 | 287.7 | 185.3 | 1361.9733 | -0.15 | -0.087 |
| 1872 | -0.355 | 287.9 | 169.2 | 1361.7310 | 1.91 | -0.056 |
| 1873 | -0.384 | 288.1 | 110.1 | 1361.6337 | 0.08 | -0.259 |
| 1874 | -0.483 | 288.4 | 74.5 | 1361.3396 | 0.59 | -0.342 |
| 1875 | -0.832 | 288.7 | 28.3 | 1361.0057 | 0.27 | -0.019 |
| 1876 | -0.497 | 289.0 | 18.9 | 1360.7805 | 0.44 | -0.024 |
| 1877 | -0.252 | 289.4 | 20.7 | 1360.7192 | -1.80 | -0.080 |
| 1878 | -0.023 | 289.8 | 5.7 | 1360.6067 | 0.17 | -0.127 |
| 1879 | -0.553 | 290.2 | 10 | 1360.5930 | 1.27 | -0.334 |
| 1880 | -0.363 | 290.7 | 53.7 | 1360.7627 | 0.79 | 0.003 |
| 1881 | -0.440 | 291.2 | 90.5 | 1361.0932 | -0.59 | -0.152 |
| 1882 | -0.336 | 291.7 | 99 | 1361.1539 | -0.60 | 0.065 |
| 1883 | -0.617 | 292.1 | 106.1 | 1361.1109 | -0.25 | -0.364 |
| 1884 | -0.724 | 292.6 | 105.8 | 1361.3241 | -0.38 | -0.262 |
| 1885 | -0.693 | 293.0 | 86.3 | 1361.2171 | -0.68 | -0.138 |
| 1886 | -0.532 | 293.3 | 42.4 | 1361.0569 | 0.70 | -0.119 |
| 1887 | -0.578 | 293.6 | 21.8 | 1360.8577 | 0.47 | -0.058 |
| 1888 | -0.594 | 293.8 | 11.2 | 1360.8100 | -1.27 | -0.101 |
| 1889 | -0.276 | 294 | 10.4 | 1360.7764 | 0.16 | -0.046 |
| 1890 | -0.446 | 294.2 | 11.8 | 1360.7650 | 0.56 | -0.191 |
| 1891 | -0.536 | 294.3 | 59.5 | 1360.8840 | -0.28 | -0.218 |
| 1892 | -0.633 | 294.5 | 121.7 | 1361.1688 | 0.52 | -0.154 |
| 1893 | -0.708 | 294.6 | 142 | 1361.3458 | 0.99 | -0.104 |
| 1894 | -0.484 | 294.7 | 130 | 1361.4701 | 0.21 | -0.199 |
| 1895 | -0.574 | 294.8 | 106.6 | 1361.3363 | -0.25 | -0.143 |
| 1896 | -0.395 | 294.9 | 69.4 | 1361.2281 | -1.55 | -0.217 |
| 1897 | -0.310 | 295.0 | 43.8 | 1360.9385 | -0.68 | 0.060 |
| 1898 | -0.396 | 295.2 | 44.4 | 1360.8914 | 0.57 | -0.062 |
| 1899 | -0.329 | 295.5 | 20.2 | 1360.8152 | 0.16 | -0.352 |
| 1900 | -0.194 | 295.8 | 15.7 | 1360.7290 | -0.65 | -0.337 |
| 1901 | -0.157 | 296.1 | 4.6 | 1360.6394 | 0.07 | -0.147 |
| 1902 | -0.398 | 296.5 | 8.5 | 1360.6319 | 0.10 | -0.067 |
| 1903 | -0.432 | 296.8 | 40.8 | 1360.7228 | 0.47 | 0.204 |
| 1904 | -0.533 | 297.2 | 70.1 | 1361.0143 | 0.39 | -0.353 |
| 1905 | -0.405 | 297.6 | 105.5 | 1361.0005 | -1.79 | 0.039 |
| 1906 | -0.184 | 298.1 | 90.1 | 1361.2441 | 0.21 | -0.600 |
| 1907 | -0.606 | 298.5 | 102.8 | 1361.1264 | -0.20 | -0.295 |
| 1908 | -0.457 | 298.9 | 80.9 | 1361.1528 | 0.28 | -0.178 |
| 1909 | -0.423 | 299.3 | 73.2 | 1361.0208 | 0.29 | -0.398 |
| 1910 | -0.333 | 299.7 | 30.9 | 1360.9185 | 1.26 | -0.545 |
| 1911 | -0.415 | 300.1 | 9.5 | 1360.7133 | -0.64 | -0.294 |
| 1912 | -0.434 | 300.4 | 6 | 1360.6625 | -0.98 | -0.454 |
| 1913 | -0.306 | 300.8 | 2.4 | 1360.7110 | -0.68 | -0.330 |
| 1914 | -0.063 | 301.1 | 16.1 | 1360.7851 | -0.93 | -0.144 |
| 1915 | -0.06 | 301.4 | 79 | 1361.0964 | 0.16 | -0.046 |
| 1916 | -0.346 | 301.7 | 95 | 1361.4054 | 0.64 | -0.105 |
| 1917 | -0.652 | 302.1 | 173.6 | 1361.5701 | 2.14 | -0.391 |
| 1918 | -0.417 | 302.4 | 134.6 | 1361.7757 | 0.05 | -0.323 |
| 1919 | -0.275 | 302.7 | 105.7 | 1361.4560 | -1.09 | -0.411 |
| 1920 | -0.262 | 303.0 | 62.7 | 1361.1199 | 0.09 | -0.363 |
| 1921 | -0.099 | 303.4 | 43.5 | 1360.8915 | 0.66 | -0.360 |
| 1922 | -0.248 | 303.8 | 23.7 | 1360.7013 | 0.33 | -0.309 |
| 1923 | -0.263 | 304.1 | 9.7 | 1360.5976 | -0.36 | -0.427 |
| 1924 | -0.314 | 304.5 | 27.9 | 1360.6045 | 0.34 | -0.441 |
| 1925 | -0.212 | 305.0 | 74 | 1360.7004 | -0.24 | -0.383 |
| 1926 | -0.064 | 305.4 | 106.5 | 1361.0393 | -0.49 | -0.498 |
| 1927 | -0.223 | 305.8 | 114.7 | 1361.3065 | 0.27 | -0.630 |
| 1928 | -0.146 | 306.3 | 129.7 | 1361.2413 | 0.42 | -0.231 |
| 1929 | -0.469 | 306.8 | 108.2 | 1361.1000 | 0.46 | -0.373 |
| 1930 | -0.108 | 307.2 | 59.4 | 1361.1858 | 0.03 | -0.335 |
| 1931 | -0.072 | 307.7 | 35.1 | 1360.9547 | 0.39 | -0.378 |
| 1932 | -0.076 | 308.2 | 18.6 | 1360.8472 | -0.68 | -0.265 |
| 1933 | -0.317 | 308.6 | 9.2 | 1360.8356 | 0.09 | -0.112 |
| 1934 | -0.025 | 309.0 | 14.6 | 1360.8648 | -0.01 | -0.088 |
| 1935 | -0.163 | 309.4 | 60.2 | 1360.9766 | 0.14 | -0.286 |
| 1936 | -0.117 | 309.8 | 132.8 | 1361.4379 | 0.03 | -0.615 |
| 1937 | -0.032 | 310.0 | 190.6 | 1361.7170 | 0.08 | -0.251 |
| 1938 | 0.152 | 310.2 | 182.6 | 1361.6735 | 0.87 | -0.356 |
| 1939 | -0.002 | 310.3 | 148 | 1361.6299 | 0.02 | -0.606 |
| 1940 | -0.041 | 310.4 | 113 | 1361.3999 | -1.52 | -0.446 |
| 1941 | -0.029 | 310.4 | 79.2 | 1361.2455 | -1.45 | -0.584 |
| 1942 | -0.046 | 310.3 | 50.8 | 1361.0801 | 0.02 | -0.801 |
| 1943 | 0.010 | 310.2 | 27.1 | 1360.9052 | 0.36 | -0.635 |
| 1944 | 0.107 | 310.1 | 16.1 | 1360.9080 | -0.28 | -0.801 |
| 1945 | -0.119 | 310.1 | 55.3 | 1361.1456 | 0.42 | -0.493 |
| 1946 | -0.078 | 310.1 | 154.3 | 1361.2842 | -0.79 | -0.453 |
| 1947 | -0.005 | 310.2 | 214.7 | 1361.7197 | 0.16 | -0.410 |
| 1948 | 0.000 | 310.3 | 193 | 1361.9235 | -0.23 | -0.652 |
| 1949 | -0.108 | 310.5 | 190.7 | 1361.7306 | -0.21 | -0.422 |
| 1950 | -0.301 | 310.7 | 118.9 | 1361.6156 | 1.51 | -0.475 |
| 1951 | -0.107 | 311.1 | 98.3 | 1361.1933 | -0.69 | -0.708 |
| 1952 | -0.063 | 311.5 | 45 | 1361.1126 | -0.22 | -0.811 |
| 1953 | 0.129 | 311.9 | 20.1 | 1361.0253 | -0.77 | -0.710 |
| 1954 | -0.145 | 312.4 | 6.6 | 1360.9819 | 0.23 | -0.541 |
| 1955 | -0.192 | 313.0 | 54.2 | 1361.1123 | 0.90 | -0.286 |
| 1956 | -0.426 | 313.6 | 200.7 | 1361.4949 | 1.02 | -0.826 |
| 1957 | -0.078 | 314.2 | 269.3 | 1362.0982 | -0.45 | -0.881 |
| 1958 | 0.041 | 314.9 | 261.7 | 1362.3628 | -0.50 | -0.743 |
| 1959 | 0.019 | 315.97 | 225.1 | 1362.0576 | -0.10 | -0.589 |
| 1960 | -0.068 | 316.91 | 159 | 1361.9256 | 0.29 | -0.656 |
| 1961 | 0.039 | 317.64 | 76.4 | 1361.5795 | -0.01 | -0.826 |
| 1962 | 0.027 | 318.45 | 53.4 | 1361.1854 | 0.39 | -0.909 |
| 1963 | 0.024 | 318.99 | 39.9 | 1361.0138 | -0.32 | -0.903 |
| 1964 | -0.283 | 319.62 | 15 | 1360.8779 | 0.54 | -1.001 |
| 1965 | -0.233 | 320.04 | 22 | 1360.8301 | -0.95 | -0.762 |
| 1966 | -0.132 | 321.38 | 66.8 | 1360.9332 | -0.54 | -0.785 |
| 1967 | -0.090 | 322.16 | 132.9 | 1361.1374 | 0.25 | -0.970 |
| 1968 | -0.207 | 323.04 | 150 | 1361.4356 | 0.20 | -1.037 |
| 1969 | -0.114 | 324.62 | 149.4 | 1361.5281 | -0.66 | -0.776 |
| 1970 | -0.054 | 325.68 | 148 | 1361.4117 | 0.29 | -1.105 |
| 1971 | -0.202 | 326.32 | 94.4 | 1361.2392 | 1.07 | -0.974 |
| 1972 | -0.225 | 327.45 | 97.6 | 1361.1948 | -0.83 | -1.136 |
| 1973 | 0.138 | 329.68 | 54.1 | 1361.0660 | 0.64 | -1.150 |
| 1974 | -0.278 | 330.18 | 49.2 | 1360.9792 | 0.96 | -1.000 |
| 1975 | -0.065 | 331.11 | 22.5 | 1360.9566 | 1.33 | -1.077 |
| 1976 | -0.354 | 332.04 | 18.4 | 1360.9440 | 0.06 | -1.322 |
| 1977 | 0.082 | 333.83 | 39.3 | 1361.0500 | -1.14 | -1.507 |
| 1978 | -0.047 | 335.40 | 131 | 1361.2295 | -0.29 | -1.550 |
| 1979 | 0.039 | 336.84 | 220.1 | 1361.7566 | -0.26 | -1.137 |
| 1980 | 0.125 | 338.75 | 218.9 | 1361.6909 | -0.43 | -1.064 |
| 1981 | 0.300 | 340.11 | 198.9 | 1361.7126 | 0.07 | -1.239 |
| 1982 | -0.020 | 341.45 | 162.4 | 1361.4217 | -1.45 | -1.024 |
| 1983 | 0.317 | 343.05 | 91 | 1361.3923 | -0.95 | -1.047 |
| 1984 | -0.047 | 344.65 | 60.5 | 1360.9775 | -0.14 | -1.261 |
| 1985 | -0.042 | 346.12 | 20.6 | 1360.8359 | -0.02 | -1.151 |
| 1986 | 0.106 | 347.42 | 14.8 | 1360.8877 | -0.32 | -1.387 |
| 1987 | 0.264 | 349.19 | 33.9 | 1360.9677 | -1.48 | -1.111 |
| 1988 | 0.361 | 351.57 | 123 | 1361.2840 | 0.74 | -1.254 |
| 1989 | 0.234 | 353.12 | 211.1 | 1361.7357 | 0.62 | -1.258 |
| 1990 | 0.490 | 354.39 | 191.8 | 1361.6844 | -0.33 | -1.366 |
| 1991 | 0.380 | 355.61 | 203.3 | 1361.5875 | -1.01 | -1.349 |
| 1992 | 0.094 | 356.45 | 133 | 1361.5255 | -1.23 | -1.066 |
| 1993 | 0.177 | 357.10 | 76.1 | 1361.3081 | -1.11 | -1.236 |
| 1994 | 0.331 | 358.83 | 44.9 | 1361.1154 | -1.35 | -1.351 |
| 1995 | 0.570 | 360.82 | 25.1 | 1361.0200 | -0.33 | -1.357 |
| 1996 | 0.228 | 362.61 | 11.6 | 1360.9005 | 0.56 | -1.510 |
| 1997 | 0.490 | 363.73 | 28.9 | 1361.0787 | -1.29 | -1.057 |
| 1998 | 0.841 | 366.70 | 88.3 | 1361.4702 | -0.23 | -1.525 |
| 1999 | 0.556 | 368.38 | 136.3 | 1361.7339 | 0.79 | -1.159 |
| 2000 | 0.474 | 369.55 | 173.9 | 1361.9522 | 0.72 | -1.078 |
| 2001 | 0.668 | 371.14 | 170.4 | 1361.9009 | -0.08 | -1.161 |
| 2002 | 0.762 | 373.28 | 163.6 | 1361.9725 | -0.72 | -1.190 |
| 2003 | 0.758 | 375.80 | 99.3 | 1361.4971 | -0.43 | -1.646 |
| 2004 | 0.660 | 377.52 | 65.3 | 1361.2960 | -0.63 | -1.260 |
| 2005 | 0.863 | 379.80 | 45.8 | 1361.1431 | -0.46 | -1.261 |
| 2006 | 0.805 | 381.90 | 24.7 | 1361.1004 | -0.28 | -1.264 |
| 2007 | 0.895 | 383.79 | 12.6 | 1361.0004 | 0.03 | -1.308 |
| 2008 | 0.682 | 385.60 | 4.2 | 1360.9794 | 1.00 | -1.163 |
| 2009 | 0.731 | 387.43 | 4.8 | 1360.9856 | -0.13 | -1.020 |
| 2010 | 0.914 | 389.90 | 24.9 | 1361.2296 | 0.95 | -1.308 |
| 2011 | 0.707 | 391.65 | 80.8 | 1361.4640 | 1.40 | -1.408 |
| 2012 | 0.761 | 393.85 | 84.5 | 1361.5920 | -0.18 | -1.411 |
| 2013 | 0.826 | 396.52 | 94 | 1361.6117 | 0.35 | -1.265 |
| 2014 | 0.866 | 398.65 | 113.3 | 1361.5882 | -0.38 | -0.989 |
| 2015 | 1.151 | 400.83 | 69.8 | 1361.7017 | -1.17 | -1.084 |
| 2016 | 1.292 | 404.24 | 39.8 | 1361.3384 | -0.46 | -0.840 |
| 2017 | 1.120 | 406.55 | 21.7 | 1361.2147 | 0.11 | -1.115 |
| 2018 | 0.941 | 408.52 | 7 | 1361.2560 | 0.09 | -1.015 |
| 2019 | 1.158 | 411.44 | 3.6 | -0.79 | -0.851 |
Let's do some math. First, a regression of dT on CO2 alone, using the R-based freeware statistics package Gretl:
Model 1: OLS, using observations 1867-2019 (T = 153)
Dependent variable: dT

             coefficient   std. error    t-ratio    p-value
  ----------------------------------------------------------
  const      -4.17731      0.132377      -31.56    2.31e-068 ***
  CO2         0.0128167    0.000408405    31.38    4.77e-068 ***

Mean dependent var  -0.044229   S.D. dependent var   0.451814
Sum squared resid    4.124960   S.E. of regression   0.165280
R-squared            0.867060   Adjusted R-squared   0.866179
F(1, 151)            984.8466   P-value(F)           4.77e-68
Log-likelihood       59.32611   Akaike criterion    -114.6522
Schwarz criterion   -108.5913   Hannan-Quinn        -112.1902
rho                  0.360023   Durbin-Watson        1.277002
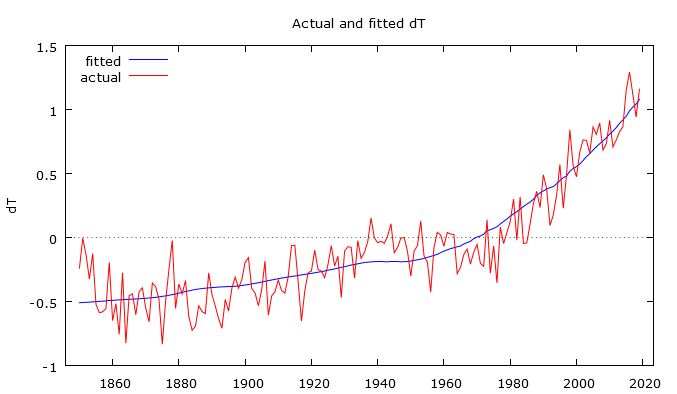
Here's what that looks like with the predicted values (blue) and the actual values (red) both graphed against time:
|
This may give us a clue to Victor's confusion. The CO2-based regression curve is relatively smooth, while the actual dT values have all kinds of zigzags up and down. Maybe what Victor means by "correlation" is "conformity to the original shape." That's not what the term means in statistics, of course.
Let's see what happens when we try for the best fit using the table data:
Model 2: OLS, using observations 1867-2019 (T = 153)
Dependent variable: dT

               coefficient   std. error   t-ratio    p-value
  -----------------------------------------------------------
  const        -3.07818      0.375077     -8.207    1.05e-013 ***
  CO2           0.00965124   0.00120088    8.037    2.77e-013 ***
  SOI          -0.0479114    0.0170797    -2.805    0.0057    ***
  SOI_1        -0.0465968    0.0169148    -2.755    0.0066    ***
  Aerosols_1    0.102327     0.0465809     2.197    0.0296    **
  dT_1          0.335131     0.0746078     4.492    1.42e-05  ***

Mean dependent var  -0.044229   S.D. dependent var   0.451814
Sum squared resid    3.146518   S.E. of regression   0.146304
R-squared            0.898593   Adjusted R-squared   0.895144
F(5, 147)            260.5209   P-value(F)           3.67e-71
Log-likelihood       80.03923   Akaike criterion    -148.0785
Schwarz criterion   -129.8958   Hannan-Quinn        -140.6924
rho                  0.018642   Durbin's h           0.598684
Not much difference in variance accounted for; we're now getting 90% instead of 87%. But this one looks different. With a number of factors brought into play, the graph looks like this:
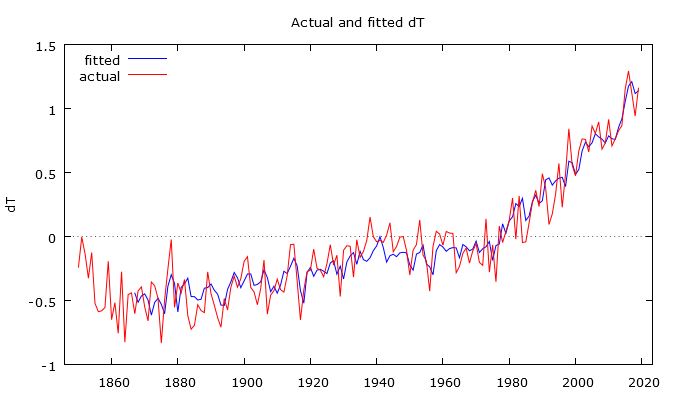 |
This one is more zigzagged, and comes closer to the original shape. It's especially closer during the 1940-1978 period Victor was worried about. Our hypothesis about what might be causing the discrepancy is confirmed; the warming effect of CO2 was temporarily overwhelmed by other factors.
| Page created: | 05/01/2022 |
| Last modified: | 05/01/2022 |
| Author: | BPL |