(c) 2009 by Barton Paul Levenson
AGW deniers often become indignant when they say "it has been cooling since 1998" (or 2000, or 2001, or 2003) and climate scientists tell them their sample size is too small for it to matter.
The World Meteorological Organization (WMO) defines climate as mean regional or global weather over a period of 30 years or more. "What's so magical about 30 years?" the deniers demand. "Why isn't 12 years significant? Or 10? Or 9? Or 6? The warmers just chose 30 years so they could deny the present global cooling!"
Let's ignore the facts that:
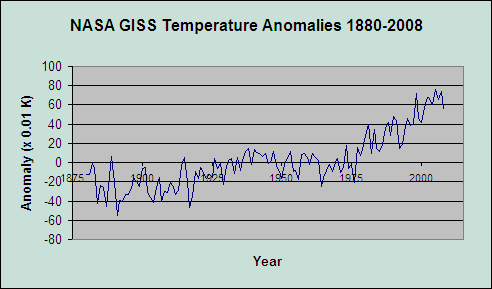
Let's just look at how WMO did their analysis--and why a decade or so is not enough to show a statistically significant temperature trend up, down or sideways. Here's the raw data: The global NASA GISS land surface temperature anomalies from 1884 to 2008. I chose the number to give a nice sample size of 125 years, which we will soon procede to break down into five-year increments:
| Year | NASA GISS Temperature Anomaly (x 0.01 K) |
|---|---|
| 1884 | -43 |
| 1885 | -24 |
| 1886 | -26 |
| 1887 | -46 |
| 1888 | -24 |
| 1889 | 6 |
| 1890 | -21 |
| 1891 | -55 |
| 1892 | -39 |
| 1893 | -40 |
| 1894 | -33 |
| 1895 | -33 |
| 1896 | -27 |
| 1897 | -16 |
| 1898 | -20 |
| 1899 | -25 |
| 1900 | -6 |
| 1901 | -5 |
| 1902 | -30 |
| 1903 | -36 |
| 1904 | -42 |
| 1905 | -26 |
| 1906 | -15 |
| 1907 | -40 |
| 1908 | -30 |
| 1909 | -31 |
| 1910 | -21 |
| 1911 | -25 |
| 1912 | -33 |
| 1913 | -29 |
| 1914 | -3 |
| 1915 | 5 |
| 1916 | -20 |
| 1917 | -47 |
| 1918 | -35 |
| 1919 | -9 |
| 1920 | -17 |
| 1921 | -5 |
| 1922 | -10 |
| 1923 | -17 |
| 1924 | -12 |
| 1925 | -16 |
| 1926 | 4 |
| 1927 | -6 |
| 1928 | -1 |
| 1929 | -23 |
| 1930 | -4 |
| 1931 | 2 |
| 1932 | 4 |
| 1933 | -11 |
| 1934 | 5 |
| 1935 | -8 |
| 1936 | 2 |
| 1937 | 12 |
| 1938 | 15 |
| 1939 | -2 |
| 1940 | 14 |
| 1941 | 11 |
| 1942 | 10 |
| 1943 | 6 |
| 1944 | 10 |
| 1945 | -1 |
| 1946 | 0 |
| 1947 | 12 |
| 1948 | -3 |
| 1949 | -9 |
| 1950 | -17 |
| 1951 | -2 |
| 1952 | 4 |
| 1953 | 12 |
| 1954 | -9 |
| 1955 | -8 |
| 1956 | -18 |
| 1957 | 8 |
| 1958 | 9 |
| 1959 | 5 |
| 1960 | -2 |
| 1961 | 10 |
| 1962 | 5 |
| 1963 | 2 |
| 1964 | -25 |
| 1965 | -15 |
| 1966 | -8 |
| 1967 | -2 |
| 1968 | -9 |
| 1969 | 0 |
| 1970 | 4 |
| 1971 | -10 |
| 1972 | -5 |
| 1973 | 18 |
| 1974 | -6 |
| 1975 | -2 |
| 1976 | -21 |
| 1977 | 16 |
| 1978 | 7 |
| 1979 | 14 |
| 1980 | 28 |
| 1981 | 40 |
| 1982 | 9 |
| 1983 | 34 |
| 1984 | 15 |
| 1985 | 12 |
| 1986 | 19 |
| 1987 | 35 |
| 1988 | 42 |
| 1989 | 28 |
| 1990 | 48 |
| 1991 | 44 |
| 1992 | 15 |
| 1993 | 19 |
| 1994 | 32 |
| 1995 | 46 |
| 1996 | 39 |
| 1997 | 41 |
| 1998 | 72 |
| 1999 | 46 |
| 2000 | 42 |
| 2001 | 57 |
| 2002 | 68 |
| 2003 | 67 |
| 2004 | 60 |
| 2005 | 76 |
| 2006 | 66 |
| 2007 | 74 |
| 2008 | 55 |
Here's all that as a chart:
 |
Now, let's take the "sample standard deviation" s of the anomaly figures in this table, increasing the sample size by 5 years each time. First we'll do 2004-2008 (five years), then 1999-2008 (ten years), and so on:
| N (years) | Stdev (x 0.01 K) |
|---|---|
| 5 | 8.96 |
| 10 | 11.27 |
| 15 | 14.27 |
| 20 | 17.93 |
| 25 | 19.72 |
| 30 | 20.04 |
| 35 | 24.38 |
| 40 | 25.68 |
| 45 | 27.88 |
| 50 | 27.30 |
| 55 | 27.40 |
| 60 | 27.21 |
| 65 | 26.53 |
| 70 | 25.74 |
| 75 | 25.14 |
| 80 | 25.10 |
| 85 | 24.93 |
| 90 | 24.96 |
| 95 | 25.75 |
| 100 | 26.51 |
| 105 | 27.30 |
| 110 | 27.41 |
| 115 | 27.62 |
| 120 | 28.22 |
| 125 | 28.59 |
The sample standard deviation, "s," is a measure of how variable a statistical sample is. It's computed like this:
| N | ||||
| SS | = | Σ | Xi2 - N μ2 | [1] |
| i=1 |
| s | = | √(SS / [N - 1]) | [2] |
The symbols have the following meanings:
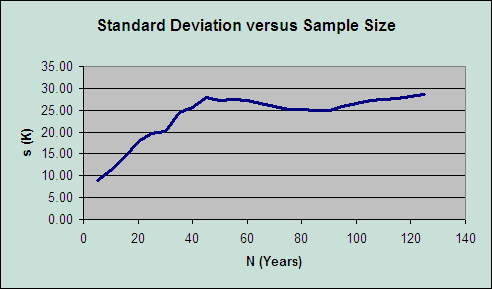
Notice what's happening in the table? The standard deviation steadily increases with sample size... until it reaches a certain point, after which the value is stable. Statisticians tell us the stable part is where you have an adequate sample size. Here it is as a chart:
 |
You will note that it actually takes 45 years for the value of s to stabilize! So for annual temperature anomalies, 45 years or more would be an adequate sample size. The WMO contented itself with hitting 2/3 of the stable value, thus coming up with the 30-year figure.
So no, it hasn't been cooling since 1998. Or 2000. Or 2001. Or 2003. Temperature jogs up and down, the time series has a lot of natural variation, and a cold spell last six years, or even twelve years, just doesn't tell you anything about what the long-term trends in climate are doing. That's the fact, Jack. The world is still warming, and we're going to be in deep, deep trouble if we do nothing to stop it.
| Page created: | 12/15/2009 |
| Last modified: | 02/01/2011 |
| Author: | BPL |