(c) 2017 by Barton Paul Levenson
The reason we even have "statistics" is because we can't tell some things exactly. Sometimes we don't know the relationship between two variables. Sometimes we don't know which, or how many, variables affect something we're studying. Sometimes we get measurement errors.
Most data is incomplete, and all data comes with error bars, and so shall it ever be. All we can do, sometimes, is make the best estimates we can, based on probability.
Let's say you have a hypothesis you want to test. You believe the bigger a planet is, the more moons it has. So you gather information on both variables. You choose, let's say, mass to measure how "big" a planet is. Then you run a test against the hypothesis you want.
"Huh? What?" I hear you cry.
That's right. The "null hypothesis" is that there is no relation between a planet's mass and number of moons. A relationship might show up in your data, but it might just be due to random chance, or sampling error.
But if that's so, you might think, how can you ever prove anything?
You can't. But you can find how probable a hypothesis is. Or how improbable.
So you run a statistical test between your two variables. The probability the null hypothesis is true is "p." For the sake of your clever idea, you hope p is as small as possible. If p is really, really small, you can "reject the null hypothesis" at a high level of confidence.
Scientists look for p < 0.1, a 10% or less probability of the null hypothesis being true. This corresponds to a 90% "confidence level." More often, they look for p < 0.05 (95% confidence) or even p < 0.01 (99% confidence). The lower the p-value, the safer you can feel about rejecting the null hypothesis. All kinds of statistical tests you can do--regression, t tests, F tests, etc.--come with a p value attached to them.
A lot of these tests give you "test statistics" you can estimate p from. t is "Student's t," named for an early statistician--W.S. Gossett--who signed his papers "Student." F is "Fisher's F," named for biologist R.A. Fisher.
There are two kinds of errors you can make with hypothesis testing.
Often, you don't know you've made either error until later. All you can do is hope for p as low as possible, and throw all the tests you can at your sample. The more tests your hypothesis survives, the more reliable it is.
This is an important point. Science--and statistical analysis--never proves anything. "Proof" means something only in mathematics or formal logic--not in science. You can never prove a scientific theory. You can only disprove it.
But in practice, that's not a problem! Disproving theories is how science advances. A theory that survives test after test from many different researchers may not be "proved," but it's stupid not to accept it at least provisionally, until a better theory comes along. In practice, a theory that goes through many tests without being rejected is "robust," and becomes part of the scientific consensus.
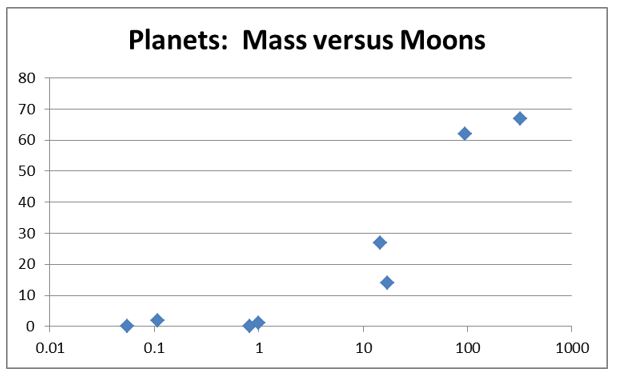
Let me run through an example for the astronomy problem I posed earlier. Do bigger planets have more moons?
Here's a table for the Solar system's eight major planets. Masses are in terms of the Earth. The chart has mass along the bottom, in log form because there is a huge range of masses involved. Number of moons is vertical in the chart, higher near the top.
| Planet | Mass (x Earth) | Moons |
|---|---|---|
| Mercury | 0.0553 | 0 |
| Venus | 0.815 | 0 |
| Earth | 1.00 | 1 |
| Mars | 0.107 | 2 |
| Jupiter | 318 | 67 |
| Saturn | 95.2 | 62 |
| Uranus | 14.5 | 27 |
| Neptune | 17.1 | 14 |
We'll run a simple statistical test on these two series--the correlation coefficient, r. Values of r range from -1 ("perfect negative correlation") to +1 ("perfect positive correlation"). We find (mathematical technique in the next chapter) that r = 0.698 between mass and number of moons. The two are positively correlated--one tends to go up or down when the other does.
What is the corresponding p figure? That depends on the sample size. r = 0.698 is a medium-strong correlation, with the "variance accounted for" being the square of r (r2 = 0.487). But because we have a very small sample size, the good correlation may be a coincidence.
For a "two-tailed test with sample size N = 8," the significance is p < 0.054 for this value of r. The result is significant at better than the 90% confidence level, which is okay, but not great. It appears, based on this one test, that bigger planets do tend to have more moons.
Or vice versa--causality could conceivably go the other way. Maybe having more moons when it's forming makes a planet more massive. How do we know that can't happen?
Or maybe a third factor causes both. We don't have enough information to tell yet. We do know we can rule out the correlation being accidental at a fairly high level of confidence.
| Page created: | 04/10/2017 |
| Last modified: | 04/13/2017 |
| Author: | BPL |