(c) 2020 by Barton Paul Levenson
It's been eleven years since I last examined the correlation between airborne carbon dioxide and temperature, so here's the data again. Temperature is from the Hadley Centre Climatic Research Unit (CRU). CO2 data is from the Law Dome ice cores for 1850-1958, and Mauna Loa for 1959-2019.
| Year | Anom | CO2 |
|---|---|---|
| 1850 | -0.239 | 284.7 |
| 1851 | -0.004 | 284.9 |
| 1852 | -0.137 | 285.0 |
| 1853 | -0.326 | 285.1 |
| 1854 | -0.125 | 285.3 |
| 1855 | -0.522 | 285.4 |
| 1856 | -0.587 | 285.6 |
| 1857 | -0.580 | 285.7 |
| 1858 | -0.555 | 285.9 |
| 1859 | -0.193 | 286.1 |
| 1860 | -0.649 | 286.2 |
| 1861 | -0.516 | 286.4 |
| 1862 | -0.756 | 286.5 |
| 1863 | -0.275 | 286.6 |
| 1864 | -0.825 | 286.8 |
| 1865 | -0.453 | 286.9 |
| 1866 | -0.440 | 287.0 |
| 1867 | -0.603 | 287.1 |
| 1868 | -0.424 | 287.2 |
| 1869 | -0.393 | 287.4 |
| 1870 | -0.549 | 287.5 |
| 1871 | -0.659 | 287.7 |
| 1872 | -0.355 | 287.9 |
| 1873 | -0.384 | 288.1 |
| 1874 | -0.483 | 288.4 |
| 1875 | -0.832 | 288.7 |
| 1876 | -0.497 | 289.0 |
| 1877 | -0.252 | 289.4 |
| 1878 | -0.023 | 289.8 |
| 1879 | -0.553 | 290.2 |
| 1880 | -0.363 | 290.7 |
| 1881 | -0.440 | 291.2 |
| 1882 | -0.336 | 291.7 |
| 1883 | -0.617 | 292.1 |
| 1884 | -0.724 | 292.6 |
| 1885 | -0.693 | 293.0 |
| 1886 | -0.532 | 293.3 |
| 1887 | -0.578 | 293.6 |
| 1888 | -0.594 | 293.8 |
| 1889 | -0.276 | 294.0 |
| 1890 | -0.446 | 294.2 |
| 1891 | -0.536 | 294.3 |
| 1892 | -0.633 | 294.5 |
| 1893 | -0.708 | 294.6 |
| 1894 | -0.484 | 294.7 |
| 1895 | -0.574 | 294.8 |
| 1896 | -0.395 | 294.9 |
| 1897 | -0.310 | 295.0 |
| 1898 | -0.396 | 295.2 |
| 1899 | -0.329 | 295.5 |
| 1900 | -0.194 | 295.8 |
| 1901 | -0.157 | 296.1 |
| 1902 | -0.398 | 296.5 |
| 1903 | -0.432 | 296.8 |
| 1904 | -0.533 | 297.2 |
| 1905 | -0.405 | 297.6 |
| 1906 | -0.184 | 298.1 |
| 1907 | -0.606 | 298.5 |
| 1908 | -0.457 | 298.9 |
| 1909 | -0.423 | 299.3 |
| 1910 | -0.333 | 299.7 |
| 1911 | -0.415 | 300.1 |
| 1912 | -0.434 | 300.4 |
| 1913 | -0.306 | 300.8 |
| 1914 | -0.063 | 301.1 |
| 1915 | -0.060 | 301.4 |
| 1916 | -0.346 | 301.7 |
| 1917 | -0.652 | 302.1 |
| 1918 | -0.417 | 302.4 |
| 1919 | -0.275 | 302.7 |
| 1920 | -0.262 | 303.0 |
| 1921 | -0.099 | 303.4 |
| 1922 | -0.248 | 303.8 |
| 1923 | -0.263 | 304.1 |
| 1924 | -0.314 | 304.5 |
| 1925 | -0.212 | 305.0 |
| 1926 | -0.064 | 305.4 |
| 1927 | -0.223 | 305.8 |
| 1928 | -0.146 | 306.3 |
| 1929 | -0.469 | 306.8 |
| 1930 | -0.108 | 307.2 |
| 1931 | -0.072 | 307.7 |
| 1932 | -0.076 | 308.2 |
| 1933 | -0.317 | 308.6 |
| 1934 | -0.025 | 309.0 |
| 1935 | -0.163 | 309.4 |
| 1936 | -0.117 | 309.8 |
| 1937 | -0.032 | 310.0 |
| 1938 | 0.152 | 310.2 |
| 1939 | -0.002 | 310.3 |
| 1940 | -0.041 | 310.4 |
| 1941 | -0.029 | 310.4 |
| 1942 | -0.046 | 310.3 |
| 1943 | 0.010 | 310.2 |
| 1944 | 0.107 | 310.1 |
| 1945 | -0.119 | 310.1 |
| 1946 | -0.078 | 310.1 |
| 1947 | -0.005 | 310.2 |
| 1948 | 0.000 | 310.3 |
| 1949 | -0.108 | 310.5 |
| 1950 | -0.301 | 310.7 |
| 1951 | -0.107 | 311.1 |
| 1952 | -0.063 | 311.5 |
| 1953 | 0.129 | 311.9 |
| 1954 | -0.145 | 312.4 |
| 1955 | -0.192 | 313.0 |
| 1956 | -0.426 | 313.6 |
| 1957 | -0.078 | 314.2 |
| 1958 | 0.041 | 314.9 |
| 1959 | 0.019 | 315.97 |
| 1960 | -0.068 | 316.91 |
| 1961 | 0.039 | 317.64 |
| 1962 | 0.027 | 318.45 |
| 1963 | 0.024 | 318.99 |
| 1964 | -0.283 | 319.62 |
| 1965 | -0.233 | 320.04 |
| 1966 | -0.132 | 321.38 |
| 1967 | -0.090 | 322.16 |
| 1968 | -0.207 | 323.04 |
| 1969 | -0.114 | 324.62 |
| 1970 | -0.054 | 325.68 |
| 1971 | -0.202 | 326.32 |
| 1972 | -0.225 | 327.45 |
| 1973 | 0.138 | 329.68 |
| 1974 | -0.278 | 330.18 |
| 1975 | -0.065 | 331.11 |
| 1976 | -0.354 | 332.04 |
| 1977 | 0.082 | 333.83 |
| 1978 | -0.047 | 335.40 |
| 1979 | 0.039 | 336.84 |
| 1980 | 0.125 | 338.75 |
| 1981 | 0.300 | 340.11 |
| 1982 | -0.020 | 341.45 |
| 1983 | 0.317 | 343.05 |
| 1984 | -0.047 | 344.65 |
| 1985 | -0.042 | 346.12 |
| 1986 | 0.106 | 347.42 |
| 1987 | 0.264 | 349.19 |
| 1988 | 0.361 | 351.57 |
| 1989 | 0.234 | 353.12 |
| 1990 | 0.490 | 354.39 |
| 1991 | 0.380 | 355.61 |
| 1992 | 0.094 | 356.45 |
| 1993 | 0.177 | 357.10 |
| 1994 | 0.331 | 358.83 |
| 1995 | 0.570 | 360.82 |
| 1996 | 0.228 | 362.61 |
| 1997 | 0.490 | 363.73 |
| 1998 | 0.841 | 366.70 |
| 1999 | 0.556 | 368.38 |
| 2000 | 0.474 | 369.55 |
| 2001 | 0.668 | 371.14 |
| 2002 | 0.762 | 373.28 |
| 2003 | 0.758 | 375.80 |
| 2004 | 0.660 | 377.52 |
| 2005 | 0.863 | 379.80 |
| 2006 | 0.805 | 381.90 |
| 2007 | 0.895 | 383.79 |
| 2008 | 0.682 | 385.60 |
| 2009 | 0.731 | 387.43 |
| 2010 | 0.914 | 389.90 |
| 2011 | 0.707 | 391.65 |
| 2012 | 0.761 | 393.85 |
| 2013 | 0.826 | 396.52 |
| 2014 | 0.866 | 398.65 |
| 2015 | 1.151 | 400.83 |
| 2016 | 1.292 | 404.24 |
| 2017 | 1.120 | 406.55 |
| 2018 | 0.941 | 408.52 |
| 2019 | 1.158 | 411.44 |
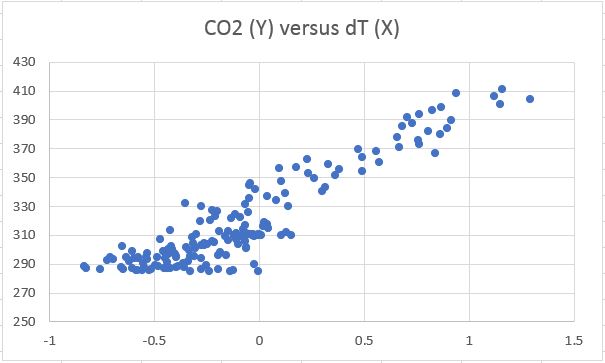
Here's CO2 (on the vertical or Y axis) graphed against temperature anomaly (on the horizontal or X axis):
|
The correlation (Pearson's r) between the two is 0.9213, so the coefficient of determination is r2 = 0.8488. With this sample size, this correlation is significant at the level p < 6.7 x 10-170.
Here's how temperature has risen with time:
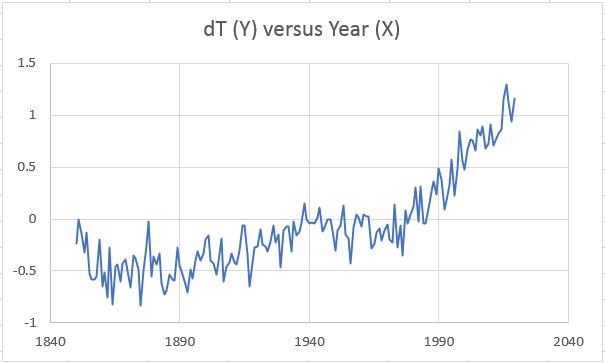 |
Anyone think there's no global warming? Or that it's not being driven by carbon dioxide? If so, there's a pseudoscience just for you!
| Page created: | 07/25/2020 |
| Last modified: | 07/25/2020 |
| Author: | BPL |